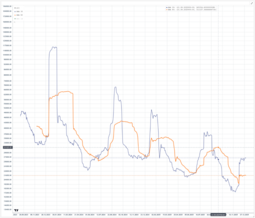
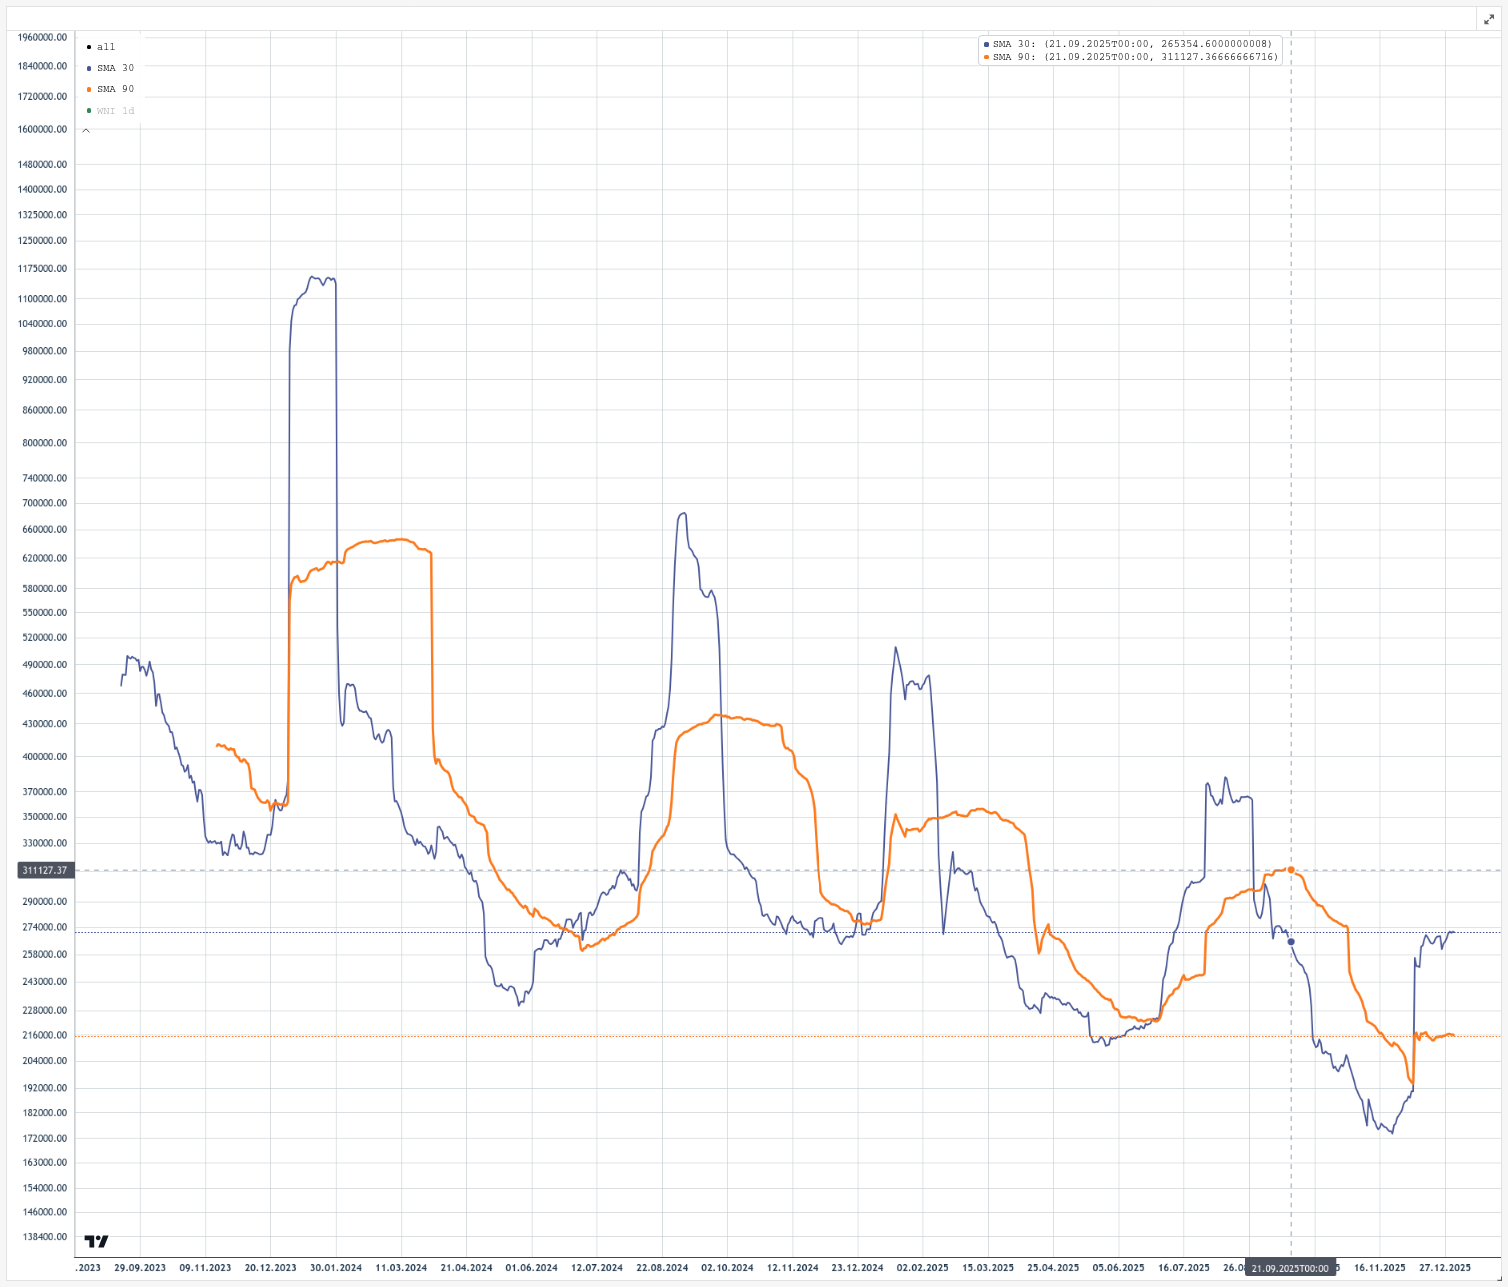
- I wrote a query to give me daily views for all the data we have. - I then abused a financial charting library to apply a 30 day (blue) and 90 day (orange) moving average to the views. - The attached pic is the result. - There's a legend in the top-left corner, and clicking on the "WNI 1d" will hide the view data and make the chart easier to read by shifting focus to the moving averages.