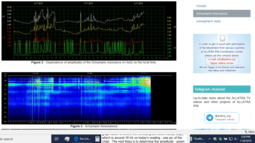
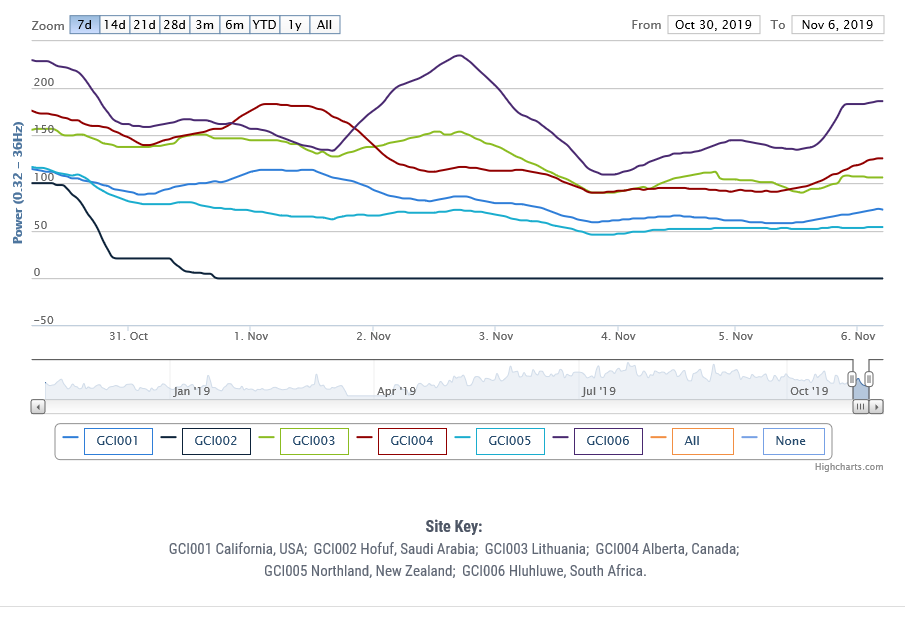
[Part 1] The amplitudes of the Schumann Resonance (SR) and its harmonic frequencies [7.83 (the base or background frequency), and the harmonics at 14, 21, 26 and 33 Hz] were high earlier today: https://geocenter.info/en/monitoring/schumann
Some people think elevated values of the SR or "consciousness currents" or "Earth's heartbeat" are related in some ways to changes in how human levels of thought, word, and deed affect Earth’s vibrational frequency and amplitude. They think that, in turn, changes in the SR affects the behavior and health status of animals and people. The 7.83 Hz base frequency of the SR correlates with human alpha brain waves, so maybe there is some type of connection. https://subtle.energy/the-schumann-effect-how-the-earth-influences-your-brain/
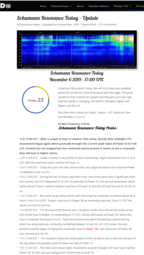
This site assigns a "power level" to the action (today's is 23): "However, when it rises to being in the 20s and above, this would seem to indicate that human levels of consciousness are elevated based upon political, sociological, philosophical frameworks, etc. and that the amplitude is now registering these heightened emotive responses." Interpretation of the SR values over the past month or so and the max peak is at the site below, which shows the time of day in both UTC and Novosibirsk Standard Time: https://www.disclosurenews.it/en/schumann-resonance-today-update/
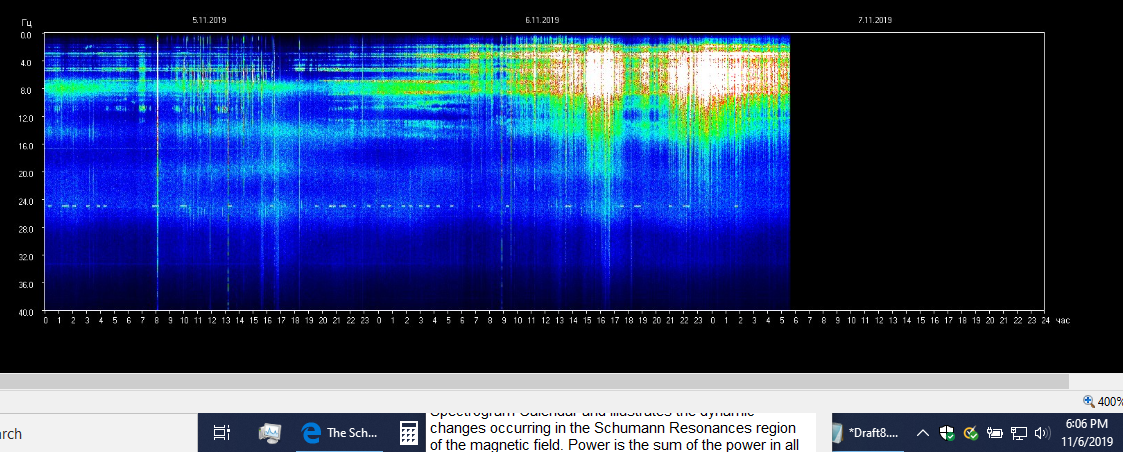
How to read the SR chart: The idea is to see how far into the harmonics the reading extends (go from the top of the graph down to where the vertical green lines mostly stop), which is around 16 Hz on today's reading - see pic of the chart. The next thing is to determine the amplitude - green is low, red is medium, white is high (can't be more definitive than that because there's no legend or key that I can read on the website, which is in Russian). The observing station where the readings are taken is in Tomsk, Russia on Novosibirsk Standard Time (11 hours ahead of EST). Zoom in to 400% if you want to see the numbers better. The horizontal axis is time, with the 24 hours of the day on the lower x axis and the date (day-month-year) on the top x axis. The vertical y axis shows the frequency with 0 hertz at the top, then 4.0 Hz, 8.0 Hz, 12.0 Hz, etc. all the way down to 400 Hz at the bottom of the y axis (where it's crossed by the x axis). The letter at the top of the vertical axis is the Russian character for the G in the Latin alphabet, which is what English uses but it's not an accepted scientific symbol in the SI measurement system: http://sosrff.tsu.ru/?page_id=7